In this article, I’ll guide you through the steps of creating a table inside table using Columnar Storage feature with Nested Data Structures in Google Big Query.
First thing to keep in mind is, In order to create a nested table, the two source tables must contain a defined relationship so that the items in one table can be related to the other table.
A structure field can contain another structure, or even an array of structures. Once you have created a structure, you can use the STRUCT function (Explained at the end of the article) or direct assignment statements to nest structures within existing structure fields.

Columnar Format AKA the Capacitor in BigQuery
Many databases store their data by rows, which look similar to a spreadsheet. All the data about a record is stored in one row. By contrast, a columnar database stores its data by columns, with the data for each column stored together.
“Columnar database stores its data by columns.”
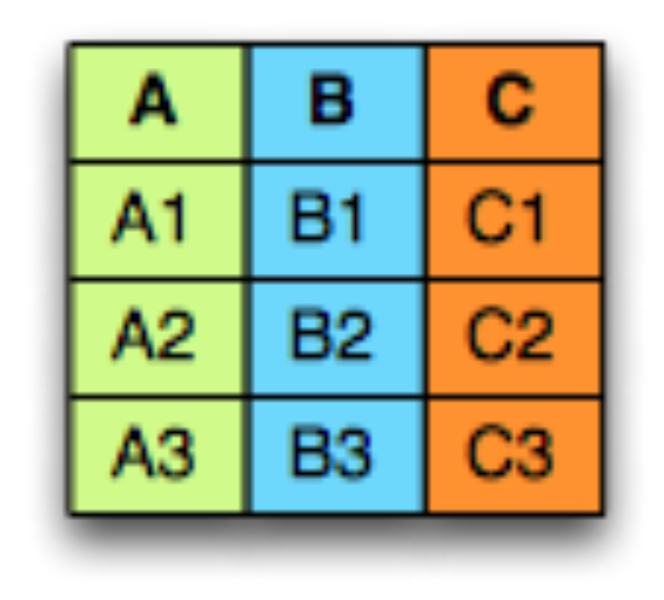
Take this data for example:

In a SQL or standard flat file database the data would be stored like this:

In a columnar database, the data would be stored like this:

Let’s use some real time example with some dummy values for the below scenario:
I want to store client ID, Name, Address and Mobile Number in a table called Clients. Take these data for an instance:
100, Dylan Jay, 137 Cairns Street, 555-1212
112, Tara Jay, 137 Dairns Road, 444-2222
In a columnar database, those data will store like this:
ID Number: {100,112}
Name: {Dylan Jay,Tara Jay}
Address: {137 Cairns Street, 137 Dairns Road}
Mobile: {555-1212,444-2222}
The main idea behind using columnar storage is to handle large amount of data for analysis, Such as business Intelligence Systems. By storing all the records for one field together, columnar databases can query and perform analysis on that similar data far quicker than row-based databases.
As an example, if you want to know the mean order total for all of your customers, a columnar database would only need to look at the order total column to pull the data, and can quickly calculate the mean. Performing the same operation in a row-based database might require scanning millions or billions of rows to gather all the values.
In BigQuery, We called this columnar format as Capacitor.
To store in a columnar format we first need to describe the data structures using a schema.There is no need for any other complex types like Maps, List or Sets as they all can be mapped to a combination of repeated fields and groups.
Let’s say we have three tables as A,B and C


OK, so both these kid tables want to be grouped with the parent A, And the combination of the table should look like this:

The JSON data file would look like the following. Notice that the B and C column contains an array of values (indicated by [ ]). The multiple B values in the array are the repeated data. The multiple fields within B are the nested data.
{
 "Aid": "100",
 "Aa": "Aa Text",
 "Ab": "Ab Text",
"B": [{
"Bid": "200",
"Ba": "Ba Text"
},
{
"Bid": "201",
"Ba": "Another Ba Text"
}], "C": [{
"Cid": "300",
"Ca": "Ca Text"
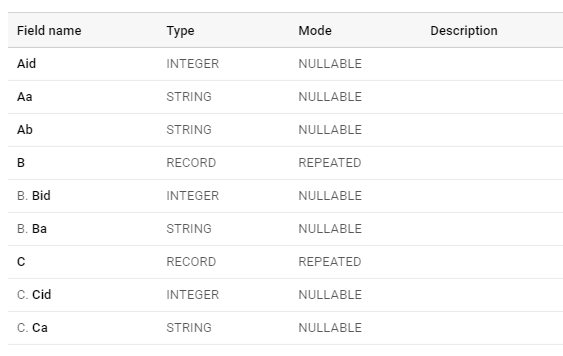
}]}The Schema for this table would look like the following:
[{
  "name": "Aid",
  "type": "INTEGER",
  "mode": "NULLABLE"
 },
 {
  "name": "Aa",
  "type": "STRING",
  "mode": "NULLABLE"
 },
 {
  "name": "Ab",
  "type": "STRING",
  "mode": "NULLABLE"
 },
 {
  "name": "B",
  "type": "RECORD",
  "mode": "REPEATED",
   "fields": [{
    "name": "Bid",
    "type": "INTEGER",
    "mode": "NULLABLE"
   },
   {
    "name": "Ba",
    "type": "STRING",
    "mode": "NULLABLE"
   }
  ]
 },
 {
  "name": "C",
  "type": "RECORD",
  "mode": "REPEATED",
  "fields": [{
    "name": "Cid",
    "type": "INTEGER",
    "mode": "NULLABLE"
   },
   {
    "name": "Ca",
    "type": "STRING",
    "mode": "NULLABLE"
   }
  ]
}]Read more about Nested and Repeated Columns Here.
A columnar format provides more efficient encoding and decoding by storing together values of the same primitive type. To store nested data structures in columnar format, we need to map the schema to a list of columns in a way that we can write records to flat columns and read them back to their original nested data structure. In Parquet, we create one column per primitive type field in the schema. If we represent the schema as a tree, the primitive types are the leaves of this tree.
We have seven(7) Yellow nodes that means we should create seven columns for our schema which We did earlier.
So, The next Question arise is that how can we create this nested data structure using SQL queries in BigQuery?
To accomplish the task, We must be familiar with STRUCT and ARRAY_AGG types. ARRAY_AGG is simply an array which returns an ARRAY of expression values.STRUCT types are declared using the angle brackets (< and >). The type of the elements of a STRUCT can be arbitrarily complex.
- Read More about STRUCT and ARRAY_AGG Types in GCP (Google Cloud Platform) here.
- Read More about Nested Structures
Go to BigQuery and start composing a new query.
CREATE TABLE
   `dataset.ABC` AS
SELECT
  a.Aid,a.Aa,a.Ab,
  ARRAY_AGG(STRUCT(b.Bid,
      b.Ba)) AS B,
      ARRAY_AGG(STRUCT(c.Cid,
      c.Ca)) AS C

FROM
  `dataset.A` As a,
  `dataset.B` As b,
  `dataset.C` As c
GROUP BY
  a.Aid,a.Aa,a.Ab
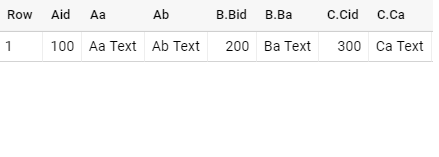
Above query will successfully create a Table ABC with Repeated Columns.

By using above steps; I’ve created this Example Client Table which makes more sense I guess :)
Realtime Example:

JSON Data FIle:
{
 "id": "1",
 "first_name": "John",
 "last_name": "Doe",
 "dob": "1968-01-22",
 "addresses": [{
  "status": "current",
  "address": "123 First Avenue",
  "city": "Seattle",
  "state": "WA",
  "zip": "11111",
  "numberOfYears": "1"
 }, {
  "status": "previous",
  "address": "456 Main Street",
  "city": "Portland",
  "state": "OR",
  "zip": "22222",
  "numberOfYears": "5"
 }]
} {
 "id": "2",
 "first_name": "Jane",
 "last_name": "Doe",
 "dob": "1980-10-16",
 "addresses": [{
  "status": "current",
  "address": "789 Any Avenue",
  "city": "New York",
  "state": "NY",
  "zip": "33333",
  "numberOfYears": "2"
 }, {
  "status": "previous",
  "address": "321 Main Street",
  "city": "Hoboken",
  "state": "NJ",
  "zip": "44444",
  "numberOfYears": "3"
 }]
}
Schema:
[
    {
        "name": "id",
        "type": "STRING",
        "mode": "NULLABLE"
    },
    {
        "name": "first_name",
        "type": "STRING",
        "mode": "NULLABLE"
    },
    {
        "name": "last_name",
        "type": "STRING",
        "mode": "NULLABLE"
    },
    {
        "name": "dob",
        "type": "DATE",
        "mode": "NULLABLE"
    },
    {
        "name": "addresses",
        "type": "RECORD",
        "mode": "REPEATED",
        "fields": [
            {
                "name": "status",
                "type": "STRING",
                "mode": "NULLABLE"
            },
            {
                "name": "address",
                "type": "STRING",
                "mode": "NULLABLE"
            },
            {
                "name": "city",
                "type": "STRING",
                "mode": "NULLABLE"
            },
            {
                "name": "state",
                "type": "STRING",
                "mode": "NULLABLE"
            },
            {
                "name": "zip",
                "type": "STRING",
                "mode": "NULLABLE"
            },
            {
                "name": "numberOfYears",
                "type": "STRING",
                "mode": "NULLABLE"
            }
        ]
    }
]
Hope I didn’t confuse or anything, Leave feedback and questions I’d be more than happy to answer!
Thank you!
Keen on getting to know me and my work? Click here for more!
A waterfall chart is a form of data visualization that helps in understanding the cumulative effect of sequentially…www.jayasekara.blog


0 Comments